
Investing is essential to building wealth and putting your money to work for you. But, successful investing seems to require making sense of financial news and forecasting the future. It goes without saying that this is risky, and much easier said than done.
Poor investing can cause your money to shrink right before your eyes, and can even jeopardize your financial future. To help you take your trading to the next level, we’ve put together a list of simple, but powerful indicators that can help you minimize risk and strengthen your investing.
Let’s dive in!
1. Trading Volume
Though modern investing is 99% digital, the human factor still drives stock price movement. To see investor sentiment in real-time, take a look at a stock’s trading volume. It’s always available when looking at a chart, or a stock’s information page on your trading platform.
What is Trading Volume?
Trading volume is a helpful technical indicator that shows the total number of shares of a stock traded during a given period of time.
Why Stock Trading Volume Matters
Trading volume provides confirmation of investor sentiment, and can hint at the beginning of a positive or negative trend. If a stock report indicates good news, and the stock price increases with above-average trading volume, this confirms that investors were happy with the news.
On the flip-side, bad news, a dropping stock price, and above-average trading volume reflects that investors have lost confidence in the stock.
How to Use Trading Volume When Investing
For stocks, not all news items are treated equally. Sometimes, news that seems insignificant can still cause investors to panic or get excited, and move the stock price accordingly. In any case, spikes in trading volume tell you what investors are thinking, so you’ll know what to do next.
Entry and Exit Points
A jump in volume coupled with an important news update can indicate the beginning of a new trend. You can use this window of time to decide if you like the direction this trend is potentially headed or not, and place your buy or sell orders accordingly.
Real vs. False Breakouts
Remember, volume is an indicator of investor sentiment, and confirms a trend.
Sometimes, a stock’s price will rise at an above-average or rapid pace, giving the appearance of a “breakout” (explained in the following section). But, if a price rises (or falls) quickly with average or below-average volume, it may be a very short lived price increase, and not a real trend.
Take a look at Apple’s (AAPL) chart below, and notice how spikes in trading volume (the vertical bars at the bottom of the chart) tend to coincide with steep price movements (shown in the light blue boxes).
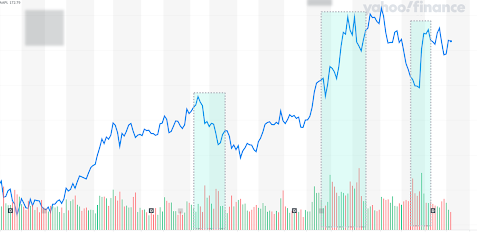
Pro Tip: Keep a close eye on trading volume; it usually appears at the bottom of a chart. Watch if strong price movements take place with strong increases in volume to have a better chance at spotting trends. If the stock prices go above or below a certain threshold, you may be on the verge of a trend. The next section will cover those thresholds in more detail.
2. Support and Resistance Levels
You’ve probably looked at a stock’s chart and noticed the following: the stock price rises, and seems to consistently hit a ceiling and decline. Or, you see a stock’s price drop quickly, only to bounce off of a seemingly magical price and bounce back up again.
You might be witnessing a stock’s resistance and support levels. Like trading volume, these two indicators are key components of technical analysis for stocks.
What Are Support Levels?
Simply put, a support level is a price or price range that a stock typically doesn’t fall below during a certain period of time. For investors, this serves as a mental floor that “supports” the stock price. While this isn’t an exact science, stocks tend to hit a support level after dropping, then “bounce” upward again.
However, when stocks fall below a support level, they tend to fall even further, toward an even lower price, and find a new support level. This is called a breakout.
What Are Resistance Levels?
Conversely, a resistance level acts as a “ceiling” for a stock on the upside. If a stock breaks through a resistance level, it may start a new upward trend, and the old resistance level then becomes a support level.
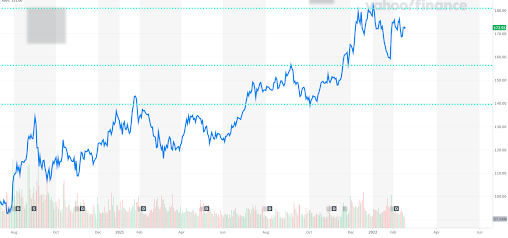
Here’s Apple’s chart again to illustrate. Once the price rises above a certain level, the old resistance is now a support level.
Why Support and Resistance Levels Matter
Similar to trading volume, support and resistance levels can reveal the potential for a trend, and can hint when it’s a possibly a good time to buy or sell. Rather than arbitrarily trying to time the market, you use support and resistance levels to hint at what might become next.
How to Use Support and Resistance Levels When Investing
So, how do you use support and resistance to your advantage when investing?
For example, if you own a stock that has increased in price, you can look at a support level as your personal sell point if the stock price falls. You can set your sell-stop orders at this price to automatically execute the sell action.
If you don’t own a stock, you can use support levels as a great entry point.
Set your stock alert notifications at or around a support level or resistance level. If the stock price breaks below a support level, you might be able to catch the price at a low price and end up with a great deal. If the stock price breaks a resistance level upward, you have an opportunity to buy shares before an upward trend!
3. Moving Average (MA)
The third important indicator to add to your toolkit is a stock’s moving average. Do you notice how a stock’s chart is sometimes hard to follow because it has a ton of ups and downs? The moving average is the average price of a stock based on a specific period of time (could be minutes, days, or weeks).
Why Moving Averages Matter
Moving averages help reduce some of the “randomness” of price fluctuations, and provide a smoother, clearer picture of a stock’s price chart, making patterns potentially easier to spot.
You can set a moving average based on the number of days of your choosing, but commonly used moving average lengths are 10, 20, 50, 100, and 200 days.
How to Use Moving Averages When Investing
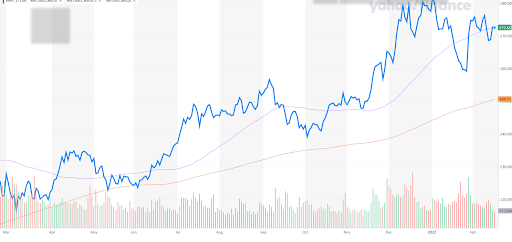
A moving average can appear as another type of support or resistance level. When the stock is experiencing an uptrend, for example, moving averages may act as a support level. Take a look at Apple’s chart below.
On the other hand, a moving average can also appear to be a resistance level when a stock is experiencing a downtrend.
Take a look at Netflix’s (NFLX) chart below. Once the stock price (blue line) falls below the two moving averages (purple and gold lines), the stock price tends to stay depressed in the short-term. Use your moving averages to spot trends, set your stock alerts, and find better prices.
Putting It All Together
While the stock indicators covered in this article are just the tip of the iceberg with respect to technical investment analysis, they can help you more effectively manage your trading, especially if you are just beginning your investing journey. By monitoring a stock’s trading volume, resistance levels, and simple moving averages, you’ll be well on your way to becoming a more successful trader.
Need some additional guidance?
Risk Alert is a simple but highly effective tool for monitoring your investments. Users of Risk Alert can decide their risk tolerance, and set alerts to be notified through SMS or email when the price of their investments drop. When combined with Opportunity Alert and Compare Alert, you have a comprehensive and easy-to-use toolkit to help minimize the risk of stock investing.
Want to learn more? Visit our website and discover how RiskAlert can keep you on top of price movements and become a more effective trader.
This material has been prepared for informational purposes only, and is not intended to provide, and should not be relied on for, tax, legal, investment or accounting advice. You should consult your own tax, legal, investment and accounting advisors before engaging in any transaction.